Edition: Food, Sugar & Industry
12 March, 2026
In The News
Vol 1, Edition 8
The Food Pyramid Was Wrong — and How Contested Science and Industry Shaped It
For three decades, Americans were told to eat 6 to 11 servings of grains per day and avoid fat at all costs. The science behind that advice was always more complicated than the pyramid suggested — and the story of how a hypothesis became federal policy is one of the most consequential chapters in modern nutrition history. To understand why the Food Pyramid was wrong, you have to look at both the science debate behind it and the commercial pressures that helped turn that debate into federal policy.
Published By: MAP30 Challenge
Authored By: John Shaw
1967
year industry-funded Harvard review shaped nutrition policy for decades
6-11
daily grain servings at the base of the 1992 Food Guide Pyramid
15%-42%
U.S. adult obesity rate: 1976–80 vs. 2017–18 (CDC/NHANES)
40 yrs
before John Yudkin's warnings about sugar were taken seriously
Why the Food Pyramid Was Built on Contested Science
When the USDA's Food Guide Pyramid was released to the American public in 1992, it arrived with the full authority of the federal government. It appeared on cereal boxes, was taught in classrooms, and shaped a generation's understanding of what healthy eating looked like. At its base: 6 to 11 daily servings of bread, cereal, rice, and pasta. At its tip: fats and oils, to be used "sparingly."
What most Americans were never told is that the science underlying those recommendations was genuinely contested — and that the path from laboratory hypothesis to federal policy was shaped not only by research, but by the commercial interests of industries whose products happened to sit at the pyramid's foundation.
Understanding how that happened requires going back to the 1950s, to a scientific debate that was never fully resolved — and whose consequences are still playing out today.
Ancel Keys and the Seven Countries Study
In 1953, American physiologist Ancel Keys presented a graph at a WHO (World Health Organization) meeting showing what appeared to be a clear relationship between the percentage of dietary calories from fat in a country's diet and its rate of death from heart disease. The correlation looked striking. Keys, already well-known for developing the K-ration field nutrition packs used during World War II, was a formidable scientific presence — well-connected, intellectually forceful, and persuasive.
Critics at the time pointed out that the graph drew on data from only six countries, while data from many more nations was available. When other researchers plotted the full dataset, the tight correlation loosened considerably — suggesting that other variables beyond fat intake might be driving the pattern.
Keys went on to lead the Seven Countries Study, a large longitudinal project spanning multiple countries that first published results in 1970. It was the first study of its kind and identified real associations between saturated fat intake and heart disease risk. It also pointed toward the benefits of what would later be called the Mediterranean diet.
But the study had well-documented limitations. Dietary assessment methods varied across country cohorts. It was observational — it could establish associations, not prove causation. And the country selection has been disputed by researchers for decades. The debate about what the study actually proved was never settled before the dietary fat hypothesis was translated into national policy.
I
"The gap between what the science showed and what the policy declared was where the real story began.
John Yudkin, Sugar, and the Research That Was Sidelined
While Keys was building his case against dietary fat, British physiologist John Yudkin was reaching a very different conclusion. Yudkin, a professor of nutrition at Queen Elizabeth College in London, believed the evidence pointed not at fat, but at sugar — specifically sucrose and the refined carbohydrates that had accompanied the modernization of the Western diet.
In 1972, Yudkin published Pure, White and Deadly, laying out research that warned sugar's role in heart disease, obesity, and metabolic dysfunction was being dangerously underestimated. He was among the first scientists to argue that it was the dramatic rise in sugar consumption — not fat intake, which had been relatively stable — that best correlated with the rise of modern chronic disease.
Keys publicly dismissed Yudkin's work in sharp terms. The scientific establishment largely followed Keys' lead. Yudkin's research was sidelined.

It would take decades for the scientific community to seriously revisit the question. In 2010, pediatric endocrinologist Robert Lustig at UC San Francisco called Yudkin's work "prophetic," stating that everything Yudkin had written about sugar had proven to be true. The rehabilitation of Yudkin's reputation has been gradual but significant — driven by a growing body of research on fructose metabolism, insulin resistance, and the downstream effects of high sugar consumption.
THE YUDKIN LESSON
Scientific consensus is not the same as settled truth. One of the most accurate voices in mid-20th century nutrition research was effectively silenced not by better data, but by a more influential opponent. The history of Yudkin and Keys is a case study in how institutional momentum shapes what gets studied, funded, and believed.
How the Sugar Industry Influenced the 1967 Harvard Review
In 2016, a team of UC San Francisco researchers published a paper in JAMA Internal Medicine that illuminated something the nutrition science community had long suspected. Dr. Cristin Kearns had discovered, while searching through archival boxes in a Harvard library basement, a detailed correspondence between a sugar industry trade group and prominent Harvard nutritionists from the 1960s.
The documents revealed this: in 1965, the Sugar Research Foundation — the industry trade group that would later become the Sugar Association — commissioned a literature review from Harvard researchers. Known internally as "Project 226," it was specifically designed to address growing scientific concern about sugar's potential role in heart disease. The industry paid the researchers the equivalent of approximately $50,000 in today's dollars. The funding was not disclosed when the review was published.
The resulting two-part review appeared in the New England Journal of Medicine in 1967. It concluded that the only dietary intervention required to prevent coronary heart disease was to reduce dietary cholesterol and replace saturated fat with polyunsaturated fat. Studies implicating sugar were criticized heavily. The limitations of fat-focused studies were handled with considerably less scrutiny.
I
"There are all kinds of ways that you can subtly manipulate the outcome of a study, which industry is very well practiced at."— Stanton Glantz, PhD, UCSF — lead researcher, JAMA Internal Medicine 2016
At the time, the New England Journal of Medicine did not require authors to disclose funding sources — a requirement not added until 1984. The 1967 review, published without disclosure of its industry funding, was cited by policymakers, used in pamphlets distributed to legislators, and woven into the dietary guidelines that followed. Its influence on the next two decades of nutrition policy was substantial and well-documented.
The Sugar Association, in its response to the 2016 findings, acknowledged that the Sugar Research Foundation "should have exercised greater transparency in all of its research activities," while noting that funding disclosures were not standard practice at the time.
How the Food Pyramid Became Federal Policy

By the mid-1970s, the dietary fat hypothesis had accumulated enough institutional momentum to reach Capitol Hill. In 1977, the U.S. Senate Select Committee on Nutrition and Human Needs, chaired by Senator George McGovern, published the "Dietary Goals for the United States" — the first federal document to set specific quantitative targets for what Americans should eat. The goals recommended reducing fat and saturated fat intake and increasing carbohydrate consumption to 55–60% of daily calories.
The guidelines were immediately controversial. Agricultural and food industry groups objected to recommendations that implied Americans should eat less of their products. Wording was revised under pressure — "decrease consumption of meat" became "decrease consumption of animal fat and choose meats, poultry, and fish which will reduce saturated fat intake."
In 1980, the first edition of the Dietary Guidelines for Americans was published. When the USDA developed a visual representation in the early 1990s, it adapted the pyramid format to those guidelines — placing 6 to 11 daily servings of bread, cereal, rice, and pasta at the base. All fats and oils were grouped at the tip under a single "use sparingly" instruction, with no distinction made between unsaturated fats — which nutrition researchers already understood to be beneficial — and saturated or trans fats.
Luise Light, one of the USDA nutritionists involved in developing the original pyramid, later stated publicly that the version released to the public had been significantly altered from what the scientific team had recommended — with refined carbohydrate servings expanded beyond what the evidence supported.
How Low-Fat Advice Led to More Sugar and Refined Carbs
The food industry responded to the low-fat guidelines with efficiency. If fat was the enemy, fat-free products were the solution. Through the 1980s and 1990s, grocery shelves filled with fat-free cookies, low-fat yogurt, reduced-fat dressings, and fat-free snack foods — all marketed as healthier choices in alignment with federal dietary advice.
There was a problem the marketing did not mention: when fat is removed from a food product, the result is often unpalatable. Fat carries flavor and provides the texture that makes food satisfying. The industry's solution was to replace it — primarily with added sugar and refined carbohydrates. Fat-free did not mean calorie-free or metabolically neutral. In many cases, it meant higher in sugar, more rapidly digested, and more likely to trigger the insulin response associated with fat storage.
The companies that drove this substitution — filling shelves with fat-free products loaded with sugar and additives — are now the subject of a landmark lawsuit filed on behalf of the People of California.

| What the Label Said | What It Often Meant |
|---|---|
| Fat-free | Sugar and refined carbohydrates substituted for fat to maintain palatability. |
| Low fat | Calorie content often similar; sugar content frequently higher than the full-fat version. |
| Reduced fat | Fat replaced by added sugars, starches, or carbohydrate-based thickeners. |
| Light | Typically reduced fat or calories, often with a corresponding increase in sugar or sodium. |
This substitution played out across the American food supply at scale. Between 1977 and 1988, Americans' fat intake as a proportion of total calories did fall — consistent with the guidelines. But total calorie intake, and particularly sugar and refined carbohydrate consumption, rose. The low-fat message had been implemented in a way that, for many Americans, simply shifted the source of excess energy without reducing metabolic strain.
One of the primary substitutes was high-fructose corn syrup — a cheaper, sweeter alternative to sugar whose effect on the liver proved far more damaging than the fat it was designed to replace.'
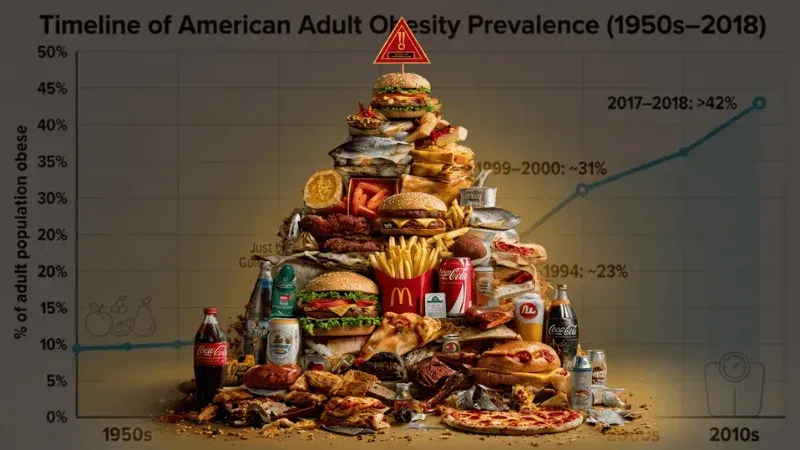
What Happened After the Food Pyramid: Obesity and Diabetes Data
The timeline of American obesity rates runs parallel to the era of low-fat dietary guidelines in ways that researchers have noted, debated, and continue to study. The data below is drawn from CDC National Health and Nutrition Examination Survey (NHANES) records.
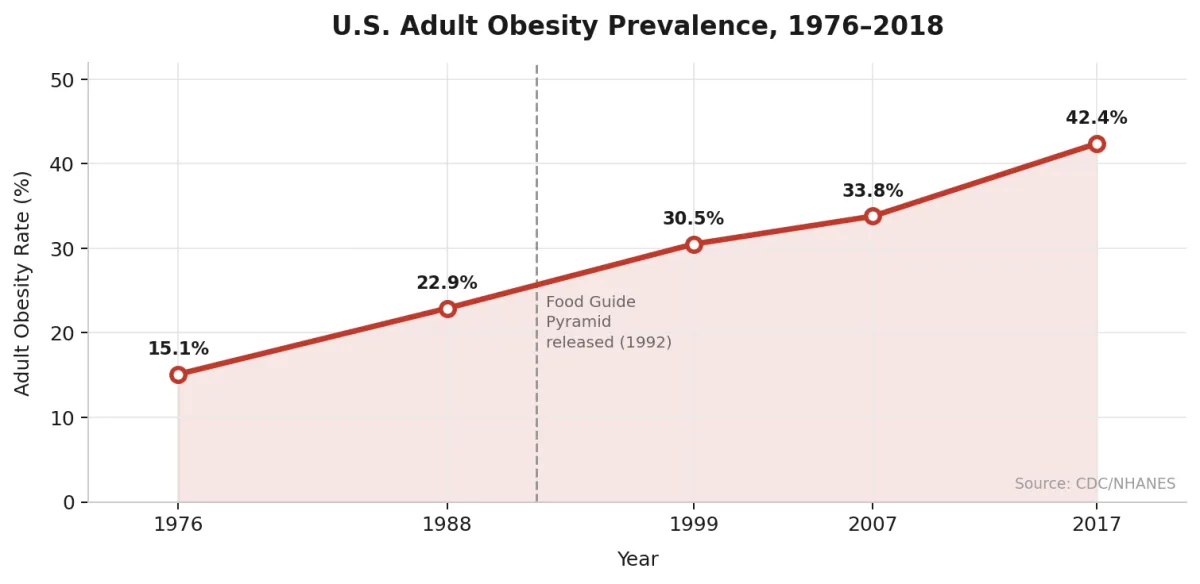
Adult obesity prevalence was approximately 15% during the period 1976–1980 — the years just before the first Dietary Guidelines were released. By 1988–1994, it had risen to roughly 23%. By 1999–2000, it had reached 31%. By 2017–2018, the figure exceeded 42%.
The rise in diagnosed diabetes cases over the same period is equally striking:
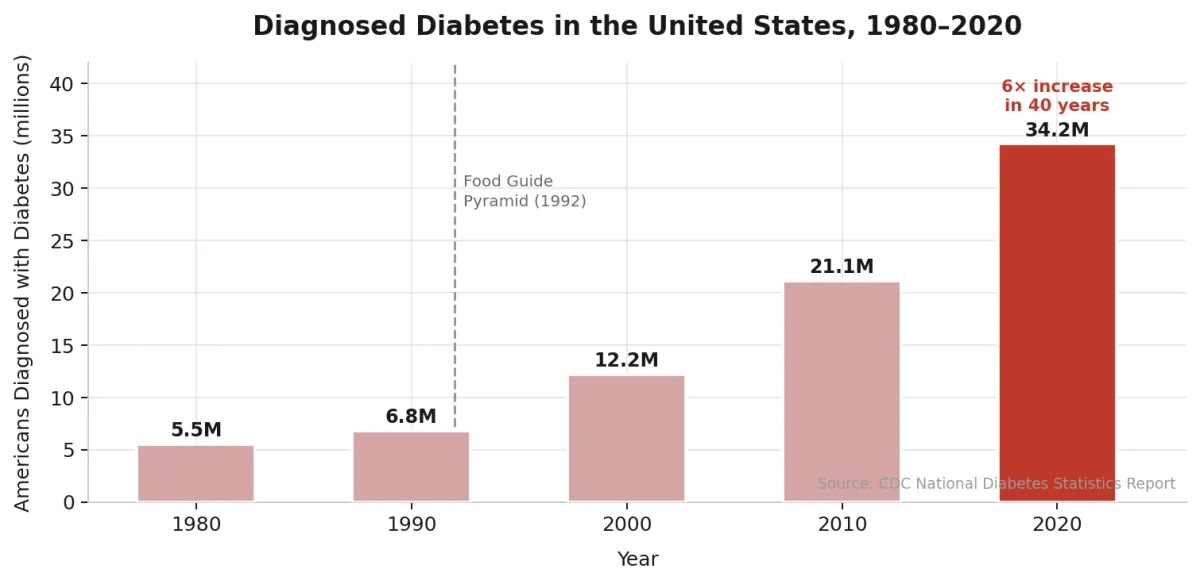
In 1980, approximately 5.5 million Americans had been diagnosed with diabetes. By 2020, that number had risen to 34 million — a more than six-fold increase in four decades.
I
"Attributing this rise to any single cause would be an overstatement. Sedentary behavior, portion sizes, and ultra-processed food all played roles. But the low-fat dietary framework did not produce the public health outcomes it was designed to produce — and that outcome is a signal worth taking seriously.
What the Science Has Since Established
The nutrition science of the past two decades has substantially redrawn the picture the Food Pyramid presented. Several developments are now supported by a substantial evidence base:
Not all fats are the same.
The pyramid grouped all fats at the "use sparingly" tier with no distinctions. Subsequent research has established that unsaturated fats — from olive oil, nuts, avocados, and fatty fish — are associated with reduced cardiovascular risk and are an important component of a healthy diet. The blanket "fat is bad" message obscured these distinctions for a generation.
Refined carbohydrates and added sugar carry significant metabolic costs.
The fructose component of added sugar is processed almost exclusively by the liver and is directly linked to the fat accumulation that drives non-alcoholic fatty liver disease and insulin resistance. The pyramid's endorsement of 6 to 11 daily servings of grains, without distinguishing whole grain from refined, encouraged a dietary pattern with measurable metabolic consequences.
Replacing saturated fat with refined carbohydrates is not a neutral trade.
A 2014 meta-analysis of 78 studies involving approximately 650,000 participants found that neither lower saturated fat consumption nor higher polyunsaturated fat consumption was independently associated with reduced cardiovascular risk. Replacing saturated fat with refined carbohydrates — which the low-fat era effectively encouraged — appears to be neutral at best, and potentially harmful at worst.
Dietary guidelines have since moved — but their legacy has not.
The Food Pyramid was replaced by MyPyramid in 2005 and MyPlate in 2011. The 2025–2030 Dietary Guidelines moved further still — with stricter limits on added sugars, stronger emphasis on protein, and explicit attention to reducing ultra-processed foods. The scientific consensus has shifted. But decades of low-fat messaging remain embedded in food culture, product marketing, and many people's intuitions about what healthy eating looks like.
What to Eat Instead of the Food Pyramid
Understanding the history of how dietary guidelines were developed is not an invitation to conclude that nutritional advice is arbitrary. The science has advanced. There are things we now know with reasonable confidence. The goal is to apply current evidence — not to be paralyzed by the history of its imperfection.
Understanding how the Food Pyramid was built is useful only if it leads to better decisions now. The practical lesson is not to obsess over old policy mistakes, but to eat in a way that reflects what the evidence now supports: more whole foods, more protein and fiber, fewer refined carbohydrates, and far less reliance on ultra-processed products.
The Bottom Line
The Food Guide Pyramid was not a cynical fabrication. It was the product of genuinely contested science, commercial pressures that shaped the policy process at multiple points, institutional momentum that hardened an unproven hypothesis into dietary dogma, and a public health system that simplified a complex topic in ways that had real consequences for public health.
The sugar industry's documented involvement in shaping the 1967 Harvard review is a matter of historical record, confirmed by internal documents and published in a peer-reviewed journal. The influence of food industry lobbying on the pyramid's final form is equally well-documented. These are verifiable events — not contested claims.
What they produced was a set of dietary guidelines that shifted the burden of metabolic concern from one macronutrient to another without reducing overall risk — and in many cases, by encouraging the consumption of fat-free processed foods loaded with added sugar, may have made things measurably worse.
The lesson is not cynicism. It is calibrated skepticism: an understanding that dietary guidelines reflect the state of the science at a particular moment, shaped by the institutional and commercial forces of that moment, and subject to revision as evidence accumulates. The science has moved. The guidelines have moved. And what we now know about refined carbohydrates, added sugar, and the inadequacy of fat as a dietary villain is a genuine advance worth building on.
I
"The pyramid told us fat was the enemy. The evidence now tells us the picture was always more complicated — and that understanding the history is the foundation for making better choices than the ones the pyramid encouraged.
Key references: Kearns CE, Schmidt LA, Glantz SA, "Sugar Industry and Coronary Heart Disease Research" (JAMA Internal Medicine, 2016); Pett K et al., "Ancel Keys and the Seven Countries Study: An Evidence-Based Response to Revisionist Histories" (True Health Initiative, 2017); Yudkin J, Pure, White and Deadly (1972); Hooper L et al., "Reduction in saturated fat intake for cardiovascular disease" (Cochrane Database, 2020); CDC/NHANES Adult Obesity Prevalence Data 1976–2023; CDC National Diabetes Statistics Report 2022; USDA Dietary Guidelines for Americans 2025–2030.

Latest Articles

Insulin Resistance
You don't need a diabetes diagnosis to have insulin resistance. Millions of Americans are living with it right now — tired, foggy...

Calorie Deficit Diet?
The calorie deficit model has been the foundation of weight loss advice for over a century. But millions of people follow it precisely...

How Does Mitochondria Work
Persistent fatigue, mid-morning crashes, brain fog, and poor sleep are not personality traits or signs of aging. They are symptoms...

John Shaw
MAP30 Challenge
John Shaw is a Certified Nutrition Educator and the founder of the MAP30 Challenge. What began as a personal health journey at 294 pounds, and pre-diabetic, evolved into a structured 30-day metabolic reset program grounded in nutritional science. John's mission is simple: give people the biological education that the diet industry never did.

Disclaimer: The information in this article is for educational and historical context only and does not constitute medical or dietary advice. Nutritional science is an evolving field and individual dietary needs vary. Consult a qualified healthcare provider or registered dietitian before making significant changes to your diet or health management plan.
FAQ's
1. What was the Food Pyramid?
The USDA Food Guide Pyramid was a federal nutrition graphic introduced in 1992. It placed bread, cereal, rice, and pasta at the base of the diet, recommended using fats sparingly, and shaped how millions of Americans were taught to think about healthy eating for nearly two decades.
2. Why was the Food Pyramid wrong?
The Food Pyramid was wrong because it simplified contested science into rigid public advice. It treated fat as a category to avoid, failed to distinguish healthy fats from harmful ones, and encouraged a grain-heavy pattern without clearly separating whole grains from refined carbohydrates and added sugar.
3. How did the sugar industry influence nutrition policy?
Documents later published in JAMA Internal Medicine showed that the Sugar Research Foundation funded Harvard researchers in the 1960s to minimize sugar’s role in heart disease and shift attention toward fat. That review influenced the scientific and policy environment that shaped later dietary guidance.
4. Did the Food Pyramid cause obesity?
The Food Pyramid did not singlehandedly cause obesity, but it helped create a low-fat, high-carbohydrate food culture that made matters worse. In practice, the guidance was often implemented through processed foods that removed fat and replaced it with sugar and refined starches, which likely contributed to worsening metabolic health.
5. Why was the Food Pyramid replaced?
The Food Pyramid was replaced because nutrition science moved on and the model had major communication and scientific weaknesses. It was replaced first by MyPyramid and later by MyPlate as federal guidance shifted toward a more updated view of diet and public health.
6. What should you eat instead of following the Food Pyramid?
A better approach is to focus on whole foods, adequate protein, vegetables, healthy fats, fiber, and fewer ultra-processed foods. Instead of building meals around refined grains, build them around foods that support satiety, blood sugar stability, and long-term metabolic health.
Sources
Kearns CE et al.
'Sugar Industry and Coronary Heart Disease Research' (JAMA Internal Medicine, 2016)
https://pubmed.ncbi.nlm.nih.gov/27617709/
Teicholz N
'The Big Fat Surprise' (Simon & Schuster, 2014)
https://www.simonandschuster.com/books/The-Big-Fat-Surprise/Nina-Teicholz/9781451624434
Westman EC et al.
'Low-carbohydrate nutrition and metabolism' (Am J Clin Nutr, 2007)
https://pubmed.ncbi.nlm.nih.gov/17684196/
Mozaffarian D et al.
'Changes in diet and lifestyle and long-term weight gain' (NEJM, 2011)
https://pubmed.ncbi.nlm.nih.gov/21696306/
Lustig RH
'Fat Chance' (Hudson Street Press, 2012)

Let Me See The Ai Audit Report
I had the MAP30 course material audited and graded by 4 dirrerent Ai models. I was shocked by the grade. See what they had to say about the MAP30 course.

Jaabsha Marketing LLC | All rights reserved 2024 Terms Of Service