Edition: Insulin & Blood Sugar
1 April, 2026
In The News
Vol 1, Edition 25
What Is HOMA-IR — The Test That Catches Insulin Resistance Years Before Your Doctor Will
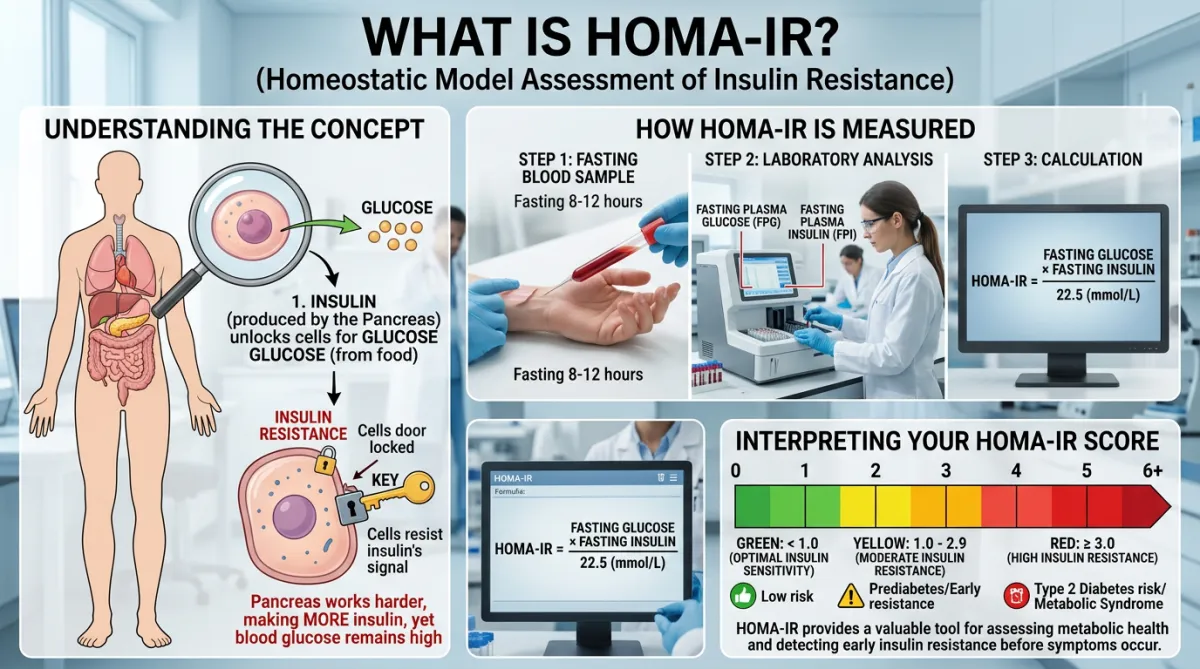
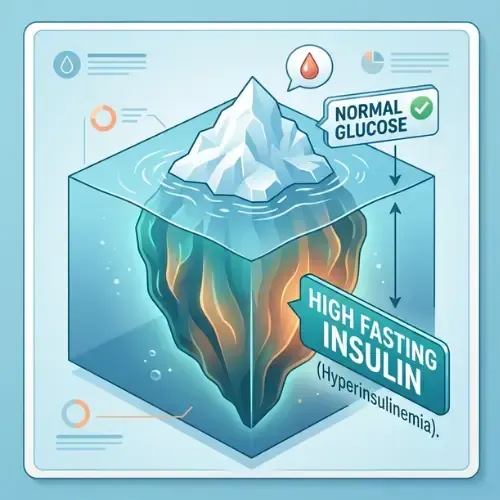
Most people with insulin resistance have normal blood sugar. That's exactly why the standard blood sugar test misses it. HOMA-IR — a calculation using fasting insulin and fasting glucose — detects insulin resistance years before the damage becomes visible on a basic blood panel.

Published By: MAP30 Challenge
Authored By: John Shaw
The HOMA-IR Calculator: What Your Score Means
| HOMA-IR Score | Interpretation | What It Means Clinically |
|---|---|---|
| Below 1.0 | Optimal insulin sensitivity | Cells respond efficiently to insulin. Metabolic flexibility is intact. Low risk of progression to metabolic disease. |
| 1.0 – 1.9 | Normal range | Acceptable insulin sensitivity. No immediate concern, but worth monitoring annually alongside other metabolic markers. |
| 2.0 – 2.9 | Borderline / early insulin resistance | Insulin is being overproduced to maintain normal glucose. This is the intervention window — before fasting glucose elevates. |
| 3.0 – 4.9 | Moderate insulin resistance | Significant metabolic dysfunction. Elevated risk of prediabetes, fatty liver disease, and metabolic syndrome. Dietary intervention urgently warranted. |
| 5.0 and above | Severe insulin resistance | High probability of existing or imminent prediabetes / type 2 diabetes. Medical evaluation and immediate metabolic intervention required. |
If your fasting blood glucose is 95 mg/dL, your doctor will tell you it's normal. If your fasting insulin is 18 μIU/mL, most doctors won't even test it. Put those two numbers into the HOMA-IR formula and you get a score of 4.3 — firmly in insulin resistance territory, and a reliable predictor of type 2 diabetes, cardiovascular disease, and metabolic syndrome within the next decade.
The problem is not that insulin resistance is hard to detect. The problem is that the standard blood panel most people receive at an annual physical does not include fasting insulin. Without fasting insulin, you cannot calculate HOMA-IR. Without
HOMA-IR, insulin resistance is effectively invisible until blood sugar crosses the diagnostic threshold for prediabetes — which typically happens a decade or more after insulin resistance first develops.
HOMA-IR changes that. It is not a new test. It has been in the research literature since 1985. It is inexpensive, requires no additional blood draw beyond what is already taken for a fasting glucose test, and it is one of the most validated tools available for detecting insulin resistance before the clinical consequences become irreversible.
"Your blood sugar can be completely normal while your insulin is three times what it should be. HOMA-IR sees the insulin. The standard panel does not."
What Is HOMA-IR and Where It Came From
HOMA stands for Homeostatic Model Assessment of Insulin Resistance. It was developed in 1985 by Matthews, Hosker, Rudenski, Naylor, Treacher, and Turner at Oxford University as a mathematical model for estimating insulin resistance and beta cell function from fasting glucose and insulin values.
The underlying principle is straightforward. In a healthy metabolic state, fasting glucose and fasting insulin exist in a predictable equilibrium. The liver releases glucose overnight to maintain blood sugar, and insulin is secreted at a low basal rate to manage it. The ratio between these two values reflects how efficiently the body is managing glucose — and specifically, how much insulin is required to maintain a given level of blood glucose.
When insulin resistance is developing, the pancreas must produce more insulin to maintain the same blood glucose level. Fasting glucose may stay normal for years — even a decade — but fasting insulin climbs. HOMA-IR captures this rising insulin-to-glucose ratio and converts it into a single number that quantifies the degree of insulin resistance present.
🔬 CLINICAL STUDY — Matthews DR et al. (1985)
Diabetologia, 28(7), 412–419
The original HOMA paper established the mathematical model for estimating insulin resistance from fasting glucose and insulin. The authors validated the model against euglycemic clamp studies — the gold standard for measuring insulin resistance — and demonstrated strong correlation. HOMA-IR has since been validated across thousands of studies in diverse populations and is now one of the most widely used surrogate markers of insulin resistance in clinical research.
Here’s The Reality: HOMA-IR is not an estimate or approximation. It is a validated mathematical model with nearly four decades of clinical research behind it. Its use in primary care remains underutilized not because it lacks validity — but because fasting insulin is rarely included in standard blood panels.
How to Calculate Your HOMA-IR Score
The calculation is simple — and you can do it yourself with any fasting blood draw that includes both fasting insulin and fasting glucose.
HOMA-IR = (Fasting Insulin × Fasting Glucose) ÷ 405
Insulin in μIU/mL · Glucose in mg/dL · Divide by 405
If glucose is in mmol/L — divide by 22.5 instead of 405
Example: A fasting insulin of 12 μIU/mL and a fasting glucose of 92 mg/dL gives a HOMA-IR of (12 × 92) ÷ 405 = 2.73. This falls in the early insulin resistance range and warrants attention — even though both individual values appear normal on a standard panel.
Here is how to read your score:
HOMA-IR Score Interpretation
Scores above 2.0 indicate the intervention window is open — even if fasting glucose still looks normal
| HOMA-IR Score | Interpretation | What It Means Clinically |
|---|---|---|
| Below 1.0 | Optimal insulin sensitivity | Cells respond efficiently to insulin. Metabolic flexibility is intact. Low risk of progression to metabolic disease. |
| 1.0 – 1.9 | Normal range | Acceptable insulin sensitivity. No immediate concern, but worth monitoring annually alongside other metabolic markers. |
| 2.0 – 2.9 | Early insulin resistance | Insulin is being overproduced to maintain normal glucose. This is the intervention window — before fasting glucose elevates. |
| 3.0 – 4.9 | Moderate insulin resistance | Significant metabolic dysfunction. Elevated risk of prediabetes, fatty liver disease, and metabolic syndrome. Dietary intervention urgently warranted. |
| 5.0 and above | Severe insulin resistance | High probability of existing or imminent prediabetes or type 2 diabetes. Medical evaluation and immediate metabolic intervention required. |
Why Fasting Glucose Alone Misses Insulin Resistance
This is the central failure of standard metabolic screening. The test that most people receive — fasting glucose — is the last marker to elevate in the progression toward type 2 diabetes. By the time fasting glucose crosses into prediabetes range (100 mg/dL), insulin resistance has typically been present for a decade or more and beta cell function may already be declining.
The sequence of events is predictable and well-documented:
Years 1–5: Insulin sensitivity decreases. The pancreas compensates by producing more insulin. Fasting glucose remains normal. No standard test flags anything.
Years 5–10: Fasting insulin climbs further. HOMA-IR rises. Visceral fat accumulates. Inflammation increases. Triglycerides rise. HDL falls. Blood pressure creeps up. Fasting glucose is still below 100 mg/dL.
Years 10–15: The pancreas begins to lose compensation capacity. Fasting glucose crosses 100 mg/dL — prediabetes. This is when most physicians first flag a problem.
Years 15+: Beta cell exhaustion progresses. Type 2 diabetes diagnosis.
HOMA-IR detects the problem during years one through ten — when the condition is most reversible and intervention is most effective. Waiting for fasting glucose to elevate means waiting until the most valuable intervention window has closed.
A large-scale validation study across multiple European populations found that HOMA-IR values above 2.5 had a sensitivity of 76% and specificity of 76% for identifying insulin resistance as defined by euglycemic clamp — confirming HOMA-IR as a practical and reliable clinical tool for population screening. (Bonora E et al., Diabetes Care, 2000)

"Fasting glucose tells you where you've been. Fasting insulin tells you where you're going. HOMA-IR tells you how fast."
What My Medical Records Showed Before My Diagnosis
The argument in this article is not theoretical. It plays out in real numbers — my own.
When I finally requested a copy of my medical records, I dropped all 250 pages into an AI and asked it to pull my A1C values chronologically. What came back stopped me cold. Not because the numbers were surprising in hindsight — but because of what they were telling me for years before anyone said the word diabetes.
My A1C Records — 2017 to 2025
Six years of readings in the prediabetes range before a single doctor said the word "insulin resistance"
| Aug 2017 | A1C: 6.3 — Already in the prediabetes range. No alarm was raised. |
| Aug 2018 | A1C: 5.8 — Dropped back into high-normal. Still no flag. |
| 2019 – 2020 | A1C: 5.7 — Two consecutive years at the prediabetes boundary. Insulin resistance building silently. |
| Feb 2022 | A1C: 6.2 — Back into prediabetes range. The trend had reversed direction. |
| Sep 2023 | A1C: 6.6 — Type 2 diabetes diagnosis. Metformin and Mounjaro prescribed. |
| Apr 2025 | A1C: 5.1 — Off all medication. Reversed through dietary change. |
Six years of A1C readings bouncing in and out of the prediabetes range. Six years of fasting glucose tests that looked acceptable enough to pass. Six years where, if someone had run fasting insulin alongside the glucose and calculated HOMA-IR, the rising insulin-to-glucose ratio would have been visible — and the intervention window would have been wide open.
That is not a criticism of anyone's medical care. It is a structural failure of standard metabolic screening. Fasting glucose was the only number anyone was watching. And fasting glucose was the last thing to move.
"The diagnosis didn't come out of nowhere. Looking back at the records, the pattern was building for years. HOMA-IR would have shown it earlier — because fasting glucose is the last marker to elevate, not the first."
John Shaw
How to Get the Test and What to Ask For
HOMA-IR requires two blood values — fasting insulin and fasting glucose — both drawn from the same fasting blood sample. The calculation can then be done manually or with any online HOMA-IR calculator.
In most cases, you will need to specifically request fasting insulin. It is not included in standard metabolic panels or comprehensive metabolic panels. The test itself is inexpensive — typically $20–$40 when ordered directly. At a standard lab appointment, simply ask for fasting insulin in addition to whatever is already being drawn.
Both values must be fasting — no food, caloric beverages, or supplements for at least 8 to 10 hours before the draw. Morning draws after an overnight fast produce the most reliable results. Strenuous exercise in the 24 hours before the test can temporarily reduce insulin levels, so light activity only before testing.
Once you have both values: (Fasting Insulin × Fasting Glucose) ÷ 405. If your fasting insulin is reported in pmol/L rather than μIU/mL, divide by 6 to convert before calculating.
What to Do If Your HOMA-IR Score Is Elevated
A HOMA-IR above 2.0 is a signal to act — not to wait and retest in another year. The most evidence-supported interventions that directly reduce fasting insulin — and therefore HOMA-IR — are straightforward.
Reduce refined carbohydrates and added sugars — the primary driver of chronically elevated fasting insulin
Incorporate fasting windows of 12–16 hours — allows insulin to fall fully between meals
Reduce visceral fat — directly improves hepatic insulin sensitivity
Improve sleep quality and duration — poor sleep independently elevates fasting insulin
Add resistance exercise — directly upregulates skeletal muscle insulin sensitivity through GLUT4 expression
Most people with HOMA-IR in the 2.0–3.5 range see measurable improvement within 8–12 weeks of consistent dietary change. The next fasting blood draw tells the story — fasting insulin comes down, HOMA-IR comes down, and for the first time there is a number that reflects the metabolic progress happening inside the body.
Key Takeaways
HOMA-IR uses fasting insulin and fasting glucose to detect insulin resistance — often a decade before fasting glucose elevates on its own
The formula: (Fasting Insulin × Fasting Glucose) ÷ 405. Below 1.0 is optimal. Above 2.0 is the intervention window. Above 3.0 warrants immediate action
Fasting insulin is not included in standard blood panels — you have to request it specifically
Normal fasting glucose does not rule out insulin resistance. It is the last marker to elevate, not the first
HOMA-IR is not just a diagnostic tool — it is a progress marker. As fasting insulin falls, the score falls, and the metabolic improvement becomes visible on a blood test
This article is part of our Insulin & Blood Sugar series
Latest Articles

24-Hour Fasting Benefits
A 16-hour fast and a 24-hour fast are not just different in duration — they produce different metabolic events. Here's what changes in that second half of the day.

Improve Your Gut Microbiome
You have more bacterial cells in your gut than human cells in your entire body. Most people know the gut microbiome exists. Almost nobody understands what it actually does.

Ultra-Processed Food
Ultra-processed food is not simply unhealthy food. It is an industrially manufactured product engineered to override hunger and drive compulsive consumption.

John Shaw
MAP30 Challenge
John Shaw is a Certified Nutrition Educator and the founder of the MAP30 Challenge. What began as a personal health journey at 294 pounds, and pre-diabetic, evolved into a structured 30-day metabolic reset program grounded in nutritional science. John's mission is simple: give people the biological education that the diet industry never did.

FAQ's
1. What is HOMA-IR?
HOMA-IR (Homeostatic Model Assessment of Insulin Resistance) is a mathematical calculation that estimates the degree of insulin resistance using two fasting blood values: fasting insulin and fasting glucose. Developed at Oxford in 1985 and validated across decades of clinical research, it is one of the most reliable tools for detecting insulin resistance before blood sugar begins to elevate.
2. How do you calculate HOMA-IR?
Multiply fasting insulin (in μIU/mL) by fasting glucose (in mg/dL), then divide by 405. Example: fasting insulin of 10 × fasting glucose of 95 = 950 ÷ 405 = 2.35. If glucose is measured in mmol/L, divide by 22.5 instead of 405. The resulting number is your HOMA-IR score.
3. What is a normal HOMA-IR score?
Scores below 1.0 indicate optimal insulin sensitivity. Scores between 1.0 and 1.9 are considered normal. Scores between 2.0 and 2.9 indicate early or borderline insulin resistance — the most important intervention window. Scores above 3.0 indicate moderate to severe insulin resistance with significantly elevated risk of progression to type 2 diabetes and metabolic syndrome.
4. Why doesn't my doctor test for HOMA-IR?
HOMA-IR requires fasting insulin, which is not included in standard blood panels. Most annual physicals order a comprehensive metabolic panel (CMP) that includes fasting glucose but not fasting insulin. Without fasting insulin, HOMA-IR cannot be calculated. You can request fasting insulin specifically at your next blood draw — it is an inexpensive add-on that provides far more metabolic information than glucose alone.
5. Can you have insulin resistance with normal blood sugar?
Yes — and this is the most important clinical fact about insulin resistance. Blood sugar can remain completely normal for a decade or more while insulin resistance develops and progresses. The pancreas compensates for declining insulin sensitivity by producing more insulin. Fasting glucose stays normal. HOMA-IR rises. By the time fasting glucose crosses into prediabetes range, insulin resistance has typically been present for 10 or more years.
6. How do you lower your HOMA-IR score?
The most evidence-supported interventions: reducing refined carbohydrates and added sugars to lower fasting insulin; incorporating fasting windows of 12–16 hours; reducing visceral fat; improving sleep quality and duration; and regular resistance exercise. Most people with HOMA-IR in the 2.0–3.5 range show significant improvement within 8–12 weeks of consistent dietary change. The reduction in fasting insulin is visible on the next blood test.
Sources
Matthews DR et al. — 'Homeostasis model assessment: insulin resistance and beta-cell function from fasting plasma glucose and insulin concentrations in man' (Diabetologia, 1985) — https://pubmed.ncbi.nlm.nih.gov/3899825/
Bonora E et al. — 'Homeostasis model assessment closely mirrors the glucose clamp technique in the assessment of insulin sensitivity' (Diabetes Care, 2000) — https://pubmed.ncbi.nlm.nih.gov/10857955/
Levy JC, Matthews DR, Hermans MP — 'Correct homeostasis model assessment (HOMA) evaluation uses the computer program' (Diabetes Care, 1998) — https://pubmed.ncbi.nlm.nih.gov/9725893/
Gutch M et al. — 'Assessment of insulin sensitivity/resistance' (Indian Journal of Endocrinology and Metabolism, 2015) — https://pubmed.ncbi.nlm.nih.gov/25593822/
Stern SE et al. — 'Identification of individuals with insulin resistance using routine clinical measurements' (Diabetes, 2005) — https://pubmed.ncbi.nlm.nih.gov/15644413/

Let Me See The Ai Audit Report
I had the MAP30 course material audited and graded by 4 dirrerent Ai models. I was shocked by the grade. See what they had to say about the MAP30 course.

Jaabsha Marketing LLC | All rights reserved 2024 Terms Of Service